
To assess energy efficiency and availability, measured data has to be recorded at various points along a process chain. Only then is it possible to make energy flows — or, put differently, cost flows — visible and to create energy transparency across the process chain. The classic approach of recording total consumption does not provide sufficient information for this, and it does not help to uncover savings potential either. Periodic records based on manual readings say little about the actual energy and cost flow, and they always look at the past.
Only detailed measurement at every machine or plant module creates energy transparency
To refine the level of detail in data acquisition, the best case is to draw on existing data sources from direct or indirect measuring devices that are already in place. Many automated processes contain machine controllers, frequency converters or evaluating protective devices such as motor circuit breakers, which are often overlooked in energy data acquisition but represent a valuable data source. Where no measuring equipment exists at all, additional measuring points can be added quite easily, for example with suitable sensors combined with IoT gateways.
In distributed systems such as production plants or infrastructure facilities, the measured data is often only visible locally at the machine or a plant section and, at best, stored in local data silos. A central data platform connected to all measuring devices solves this. With a modern, web-based platform technology such as an IoT platform, this is also quite easy to implement in practice.
A further approach lies in creating so-called virtual measuring points. Here the actual consumption figures are derived from existing measured values combined with additional information. A classic example is batch- or product-related consumption in production.
Visualising energy data has to serve different needs
The energy and cost flow must be representable and traceable. Numerous departments in a company depend on the data from energy monitoring. Production managers and quality assurance need energy data for process control among other things, maintenance staff for condition monitoring, energy controlling for billing and efficiency improvement, management for the key figures used in long-term planning of energy resources or the green factory strategy, and finally the marketing department for calculating the CO2 footprint of production. Different needs have to be served, and barrier-free access to energy KPIs has to be made possible. With a central IoT platform, these requirements can easily be put into practice and digitalised.
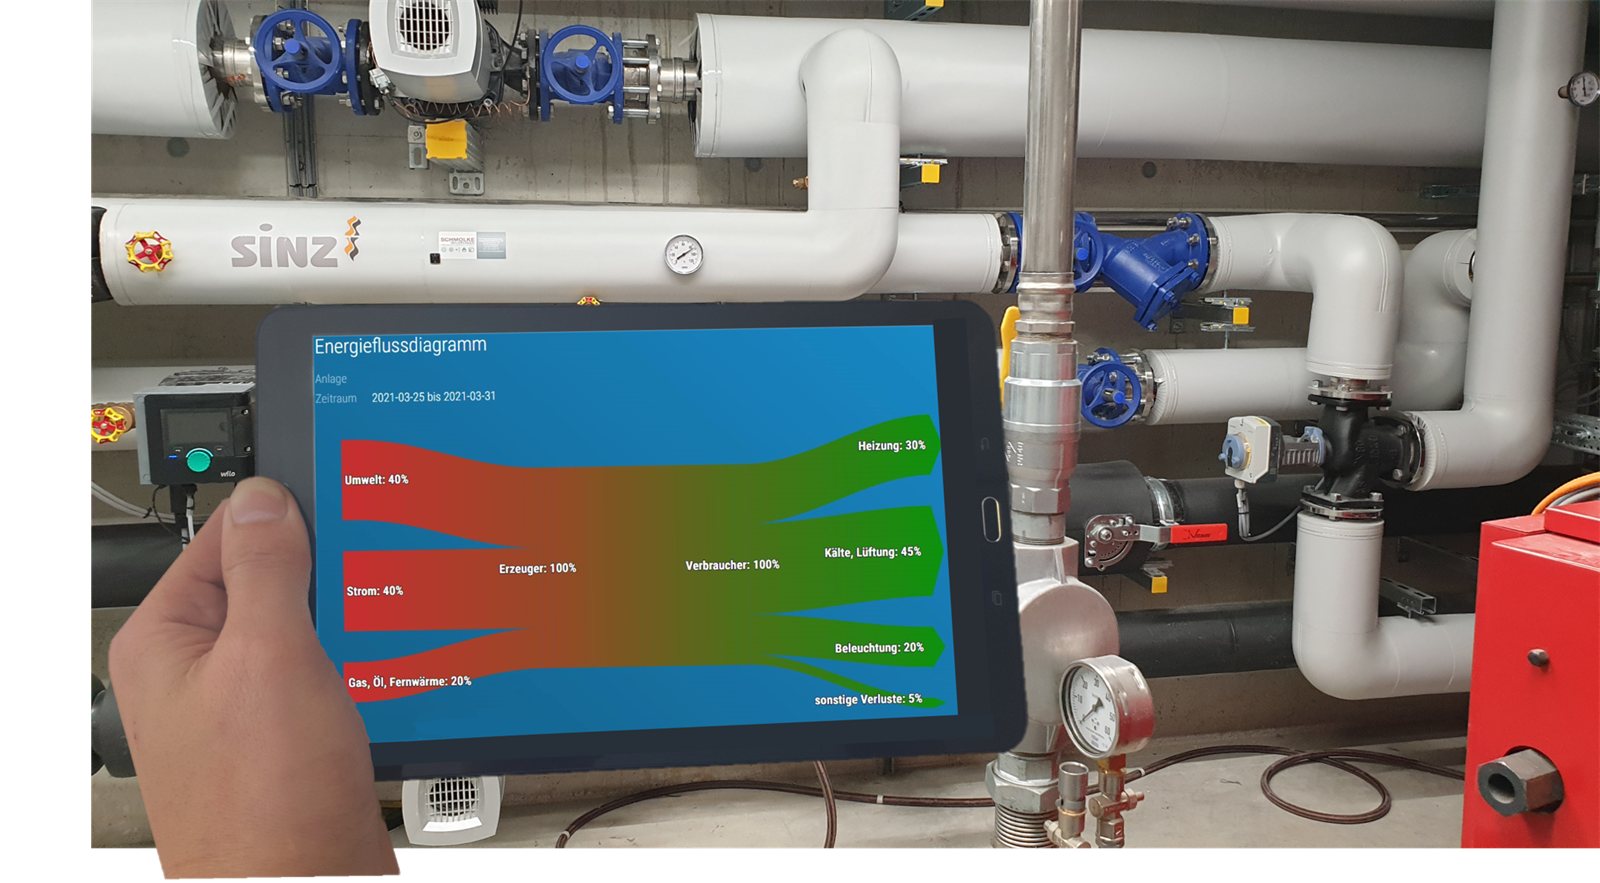
At the push of a button, energy monitoring, condition monitoring, energy controlling and management receive the right key figures and views for their particular question. Evidence of energy histories for internal and external auditors can also be provided effortlessly this way. Thanks to continuous data acquisition and archiving, evaluations can be produced for any period and any production run. Looking at a wide variety of measured values together in context quickly reveals correlations. A so-called Sankey diagram makes energy flows and losses visible at the push of a button. Cost and energy flows thus become transparent across the whole of production.
You cannot see energy losses and rarely smell them — notification functions make energy monitoring far easier
Energy losses often go unnoticed while a process is running, or are only discovered too late, for example when the bill arrives. Energy processes that regulate themselves are usually designed only for supply, not for optimal energy utilisation. Take the compressed-air system of a production line: it continuously produces the required pressure specified by a setpoint device. If the production plant stands still on non-working days, the compressed-air system nevertheless keeps running. If a leak in the compressed-air distribution occurs on top of that, the compressor system runs continuously and consumes energy. In the best case this is noticed only by an attentive employee. Digital monitoring of operating times and automated trend analysis of the consumption values reveal the undesirable development early on and alert maintenance staff in good time. Intelligent energy monitoring with continuous data acquisition makes it possible to define preset limit values and escalation levels for every energy history. That makes condition monitoring considerably easier, safeguards resources and prevents economic damage.
Analysis tools find savings potential early and continuously
Successful energy monitoring helps to find savings potential. Continuous data acquisition and analysis offer decisive advantages over a one-off snapshot. With intelligent analysis tools and the automated generation of energy KPIs, problem areas are found quickly.
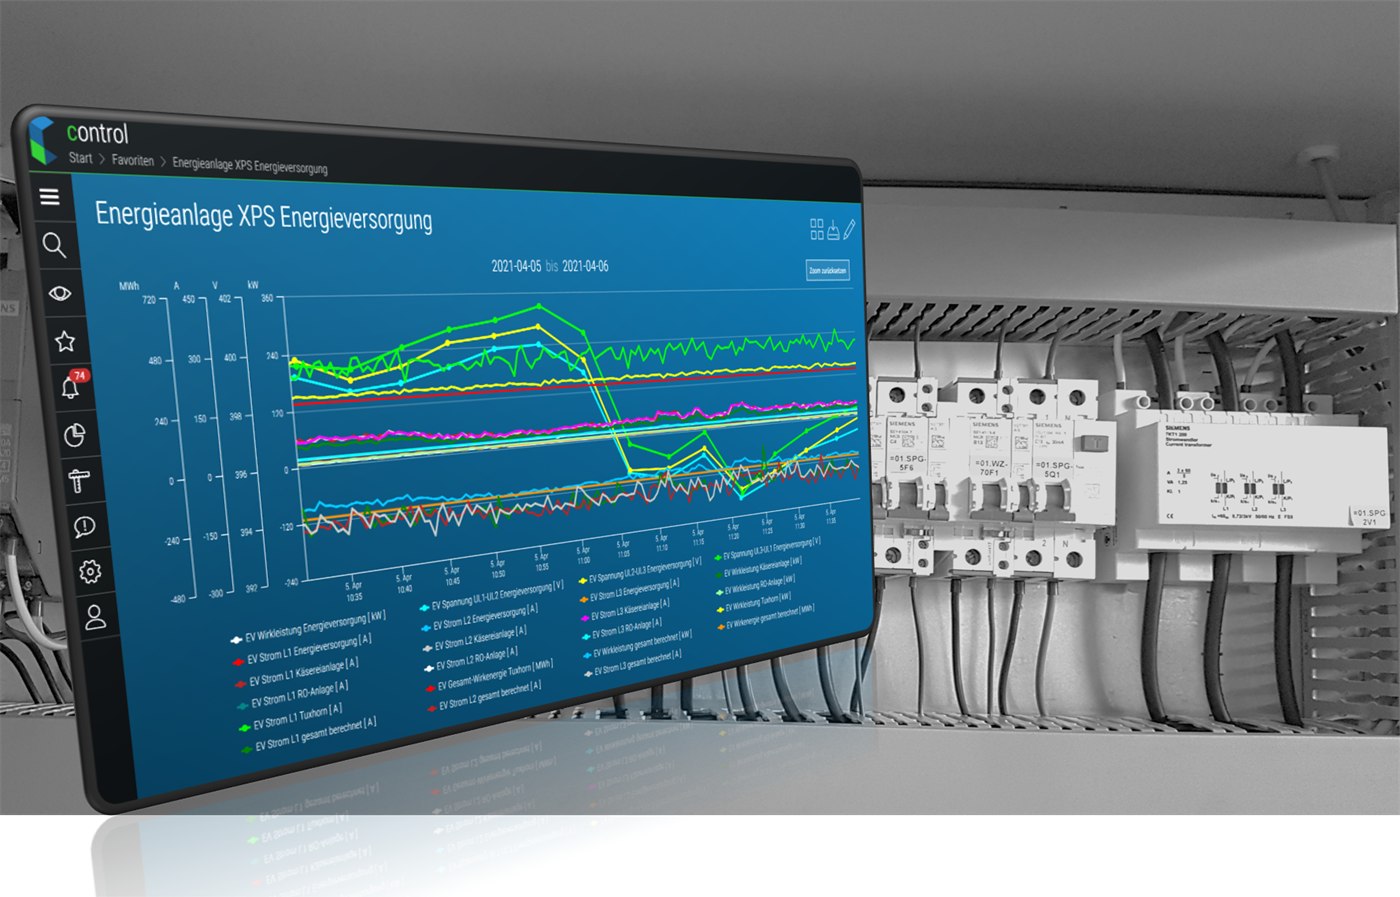
Digital measurement series make energy consumption visible. Looking at the data in context uncovers correlations, and reports generate the corresponding energy KPIs automatically at the push of a button.
Improvement measures that have already been taken can be verified continuously with the analysis tools. Evidence for the continuous improvement process is therefore easy to provide. Combined with production data such as output, throughput time and other factors, machine- or plant-specific assessments can be carried out.
Intelligent energy management secures energy flows sustainably and solves new challenges
When is which form of energy needed? How much energy is needed? How do you react to short-term process changes? These are familiar questions that energy management deals with and has to answer. The more complex the forms of energy supply become — through renewable energy sources, for instance — the more carefully energy has to be managed. On the consumption side, too, requirements are rising as production cycles become ever shorter and more individual. Energy management has to balance supply and demand. On top of that come further requirements arising from energy controlling, the green factory strategy or the goal of CO2-neutral production. Intelligent, automated and digitalised energy management helps here. All data on supply, in-house generation, storage and consumption is available centrally on one data platform. At best, the production data is already known per order or determined automatically. Forecasts can therefore be produced, or sensible time windows chosen for production. Power-intensive processes can be shifted into the phase of in-house generation, for example. Much like the remaining runtime indicator on a smartphone battery, forecasts can be created for the course of production. Peak loads can likewise be absorbed and intelligently distributed with an intelligent energy management system. New requirements and new generation and storage technologies call for networked action in energy distribution. An IoT platform makes this networking possible and provides the tools needed for analysis and intelligent energy management.
Energy monitoring with an IoT platform can be installed easily and started in a scalable way
An IoT platform offers the best conditions for networked action in energy management, energy controlling and energy monitoring. The necessary infrastructure is provided by the existing company network and the internet connection. IoT gateways and ready-to-use operational data acquisition edge boxes can be integrated into existing plants without difficulty. The end devices come with the appropriate interfaces to existing measuring equipment or bring the sensors along with them. Tapping into local energy data sources is therefore no longer a major challenge. The IoT platform control offers the possibility of building an energy management system in a scalable way. The number of measuring points, users and functions can be extended at will. The experts at digifai support you with the concept, installation, commissioning and ongoing operation. Temporary installations and test installations are also available.
Realise energy monitoring quickly and easily with the IoT platform control.