 English
 Deutsch

// Product
control
control connects, visualizes, notifies, analyzes and orchestrates process data independently from any location. You already have the source data – control shows you the relevant correlations.
- Industrial IoT Platform
- Acquisition, display and evaluation of machine key figures
- Clear, intuitive and ready to use
// More Quality & Efficiency – Less Risk
control puts you in absolute control of your process data, even remotely.
Smart Networking via Secure Web Technology
As an industrial IoT platform (IIoT), control seamlessly connects a wide variety of data sources from the production level to all company functions via the cloud. Centralized data management facilitates information sharing and provides full transparency in the process. The acquired data enhances the continuous improvement process, makes procedures traceable and enables smart process linking.
Effective Monitoring of Machine and Operating Data
control provides effective and modern monitoring via web technology and makes process information available for mobile use. User-friendly and clear administration through dashboards and a favorites function ensure fast information gathering for decisions. Automated notification of limit values, events or alarms guarantees a fast response in case of malfunctions.
Operating Data, Analysis and Reporting
control records machine data such as operation and downtime and enables the user to digitally collect production-related information such as quality or job data by entering it at PDA terminals.
control provides the data basis for cross-divisional analyses in the process. The continuous trend analysis of process values, triggered by limit values, generates information in advance and detects undesirable developments at an early stage.
The data obtained is used to calculate key figures directly from the process, such as capacity utilization and overall equipment effectiveness (OEE). The summary is made available online in web reports. Data series and evaluations can easily be exported.
// Functions
Overview of the Available Features
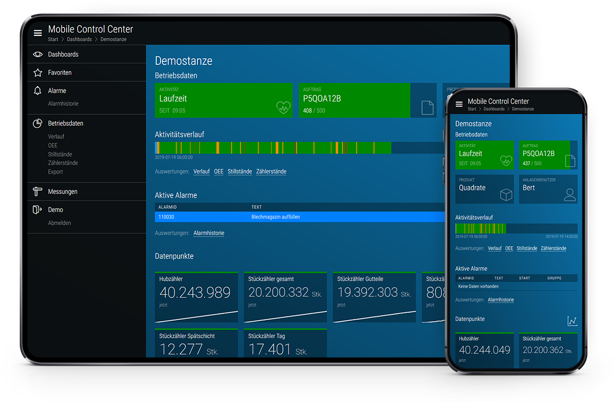
Monitoring and Visualization
We have rethought the presentation of your process data. The latest web technology, responsive displays and interactive curves bring real added value and not just pretty images.
Monitoring and Visualization
Mobile SCADA
Mobile SCADA for process, machine and operating data.
Trending
Trending graphically visualizes a line with x as time and y as value based on the chronologically stored values.
Trend comparison for data histories
Data curves of several values can be displayed simultaneously. The curves are color-coded and can be individually displayed or hidden. The data curve has a zoom function for the time axis.
Time Range Selection
Time range selection to visualize for a user-defined data value period.
Dashboard
Dashboard for the activity overview of data points, alarms and messages.
Data Value Tile for Quick Overview
The presentation of data values in a tile distinguishes clearly between information on different data values. On the data tile the information about the current data value, the most recent change and the trend is clearly visible at one single point.
Condition-Based Color Coding
color coding depending on the status for data values (red, orange, green, blue) can be integrated or data retrieved.
Favorites for data points freely adjustable
The favorites function allows the user to independently create data point sets from a variety of data points.
Graphical User Interface
Graphical interface for information display and operation.
Switchable View Modes
Views can be switched between data value tile and data value list
Menu Navigation
Menu navigation via menu, browser functions and links
Responsive Design
Content automatically adapts to any display size
Optimized contrast adjustment of the user interface
The visualization and contrast adjustment is adapted to difficult environmental conditions such as interfering light effects, extreme darkness, sunlight and stray light sources.
Search Function Online
Makes all contents and texts of the platform searchable.
Large Scale Display
Display scalable to large screen display. For example large displays in the production area. Displayed content can be controlled via favorites sets. BDE reports on large displays in the production line. The contents are created in a personalized way from web reports.
MCC – iframe
Via Inlineframe (iframe) contents of external websites are displayed in MCC. This function enables the summarizing of information from different websites or parts of websites in one platform under one link.
Multilingual through language selection
The application language can be switched online.
Notification and Alerts
control monitors your process data. Around the clock. And if something is not right, you will be notified. By mail, voice call or whichever way you prefer.
Notification and Alerts
Alarm Data Acquisition
Get alarm messages from the field level and store them in the cloud. Management of ID, message text, time stamp, status, acknowledgement. Import of the original alarm texts from the controller. Alarm messages are imported ad hoc in real time from the controller.
Operating Status Messages
Import of status messages from the controller.
Alarm Display
Display of alarms in a standardized and clear visualization.
Alarm History
Alarm history recording for traceability of events. Management and filtered provision of historical messages.
Virtual Alarms
Generation of virtual alarms on triggered data limits.
Notification Popup
Popup messages in the GUI when an alarm or operating message occurs.
SMS Notification
Sends information about alarms and operating statuses via SMS
Summary Display of Notifications and Alerts
The total amount of alarms and notifications is highlighted in color on the top menu level.
Machine and Production Data Acquisition
In large production facilities there is a large body of data. control collects them all: piece counters, cycle times, operating hours, reasons for downtime – to name just a few.
Machine and production data acquisition
Machine Data Acquisition Online
Record machine-specific values such as operating hours, reasons for downtime, maintenance, power consumption, etc. via the control system.
Volume Counter Inline
Recording of object-related quantities, for example station-related or consumption-related.
Automatic logging of cycle times
Recording of station-related cycle times.
Automatically record reasons for downtime
Record, store and log downtimes and reasons from the control system.
Digital Timer
Recording and historical storage of object-related times in the controller.
Trending Graph Generator
For example, take performance data from the generator and the load reduction from the controller, record, log and export them to web reports.
Production Data Acquisition
Import production data such as quantity counters, cycle times, degree of utilization, filling levels, temperature, etc. from the control system and visualize them in reports.
Virtual Operating Hours Counter
Use the machine data to determine the total number of operating hours.
Quality Counter
Takes data from good and bad part counting directly from the controller.
Energy Data Acquisition
Collect and store energy data from machine data, consumption meters or calculated data values
Data Sources and Interfaces
control grew up multilingual. From the moment of birth. Whether it is OPC-UA, Modbus, MQTT, SQL, Profinet, TCP/IP, control offers modules for every protocol and for every interface.
Data sources and data interfaces
Sensor Data Acquisition
Import data points from controllers and log them with time stamps
Web Service
Exchange of data via web service. For example communication with websites or BIS (Business Intelligence Systems).
Type Dependent Data Values
Acquire data points depending on type and save them with a time stamp.
CSV Connector
Import of data from third-party systems in CSV format. Send process data to third-party system in CSV format for further processing there.
KNX Interface
Transfer of data from KNX systems. Control of KNX equipment.
LoRa Interface
Import of data from LoRa networks. Control of LoRa actuators
Microsoft Azure
Stored data is exchangeable with Microsoft Azure.
Modbus Interface
Import of data from Modbus systems. Control of Modbus systems.
MQTT
Import of data from the MQTT format.
OPC and OPC/UA Interface
Transfer of data from OPC systems. Control of OPC systems.
VKW Energiecockpit Interface
Import and transfer energy data from and to the VKW Energiecockpit.
CSV Generator
Export function to CSV from any data point display
Data Management
Database Application
Database application protected against manipulation and unauthorized access
SSL Connection to Data Source
SSL connection to data source secured by VPN and a certificate with 128-bit encryption.
HTTPS Connection to Client
The clients communicate with the server via a Hypertext Transfer Protocol Secure (HTTPS) client connection.
Client Access Control
Client access authorization controlled by user and role administration.
Client Session Based Login System
Separate user login for each session. In case of inactivity the user will be logged out automatically.
Data Point Archiving
Stores the data from the control system, the machines and processes in a central database.
Datapoint Based Update Interval
The update interval is adjustable per data point
Local Data Buffering
A local data buffer on the machine, in the factory or building section stores the periodic data values on site in a local database.
Reporting
Generating real key figures from the endless raw data and carrying out automatic evaluations – that’s what control is for. Create comprehensive reports and keep an eye on your equipment.
Reporting
Mobile Process Data Display
Enables mobile access to process data. Standard off-the-shelf smart devices are used for visualization.
Maximum Values
Calculation and display of minimum and maximum values and the corresponding times for any data points over a definable observation period.
Key Figures
Statistical key values such as the standard deviation in the process are formed using the raw data from the control system.
Mobile Data Analysis
The user can perform evaluations directly in the MCC
MCC OEE
Calculates the overall equipment effectiveness (OEE) based on the data of the individual processes.
Workflow and AI
Use formulas to generate new data points from existing ones and use AI-based analysis to better evaluate your process data.
Workflow and AI
Virtual Data Points
Combine individual real data points into a virtual data point.
Advance Notification
AI analyses are used to generate advance warning messages.
// Fields of Application
Where to Use Control?
// References
Our Customers’ Opinion
During the project, the requirements regarding temperature display and alarm forwarding became more and more demanding. With digifai control we found the perfect solution to realize this project.

control is used in our quality management. The digital recording of process data improves data quality and eliminates the previously cumbersome and inaccurate manual recording.
// Request Demo
Test control now!

// Contact
Curious?
Do you have a concrete project in mind or would you like advice on whether you can benefit from digifai? I look forward to your message.

Michael Eberle
Head of digifai
+43 5572 55580 803
michael.eberle@digifai.com